


Key Insights
- Bitcoin price closed above its 50-week moving average for the first time in 45 weeks.
- BTC has gained about 38.6% in Q3 through Sept. 20 as the recovery extends.
- Analysts see $83,000 as the next breakout test, while a $370,000 cycle target remains speculative.
Bitcoin price entered the new week above $81,000 after recording its first weekly close above the 50-week moving average since November 2025. The technical reclaim strengthened the recovery from Bitcoin’s June low, although traders still face resistance around $83,000.
CoinGecko showed Bitcoin near $81,217 at the latest reading, with a 24-hour range between roughly $80,155 and $82,012. BTC was up about 5.6% over seven days.
Bitcoin Price Closes Above 50-Week Moving Average
Bitcoin ended the week around $81,159-$81,169. TradingView data placed the 50-week moving average near $78,788, meaning BTC finished approximately 3% above the long-term trend indicator.
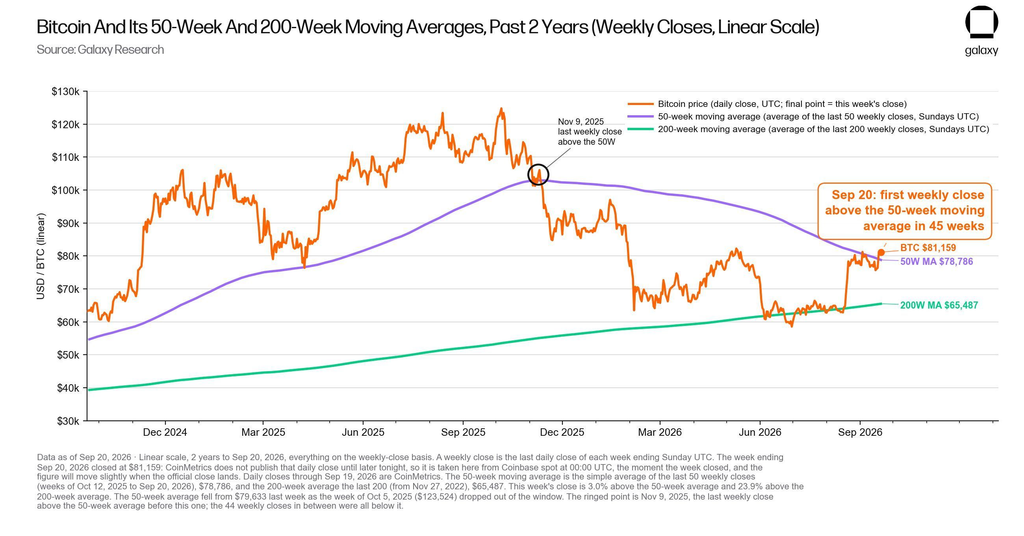
It marked Bitcoin’s first weekly close above the 50-week moving average in 45 weeks. The previous weekly close above the indicator occurred on Nov. 9, 2025.
Galaxy Head of Firmwide Research Alex Thorn highlighted the development as historically constructive.
Galaxy studied 13 previous weekly reclaims of the 50-week moving average. In 11 cases, Bitcoin did not subsequently establish a new cycle low.
That historical record does not guarantee the June 2026 low will hold.
Two previous signals failed during late 2021 and early 2022, when Bitcoin briefly reclaimed the moving average before falling to new lows.
Bitcoin has nevertheless strengthened substantially from its recent lows.
Thorn said BTC had gained about 29% over the preceding 35 days when the weekly candle closed.
Bitcoin Price Prediction Puts $83K in Focus
Daan Crypto Trades identified approximately $83,000 as the next important market-structure level.
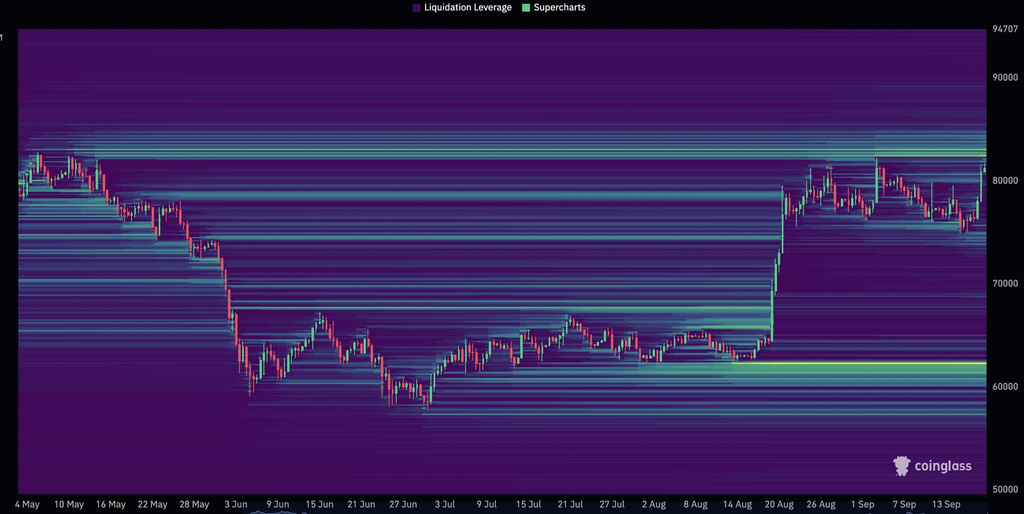
The trader said Bitcoin had moved through much of the liquidity immediately above $80,000 but still faced another concentration near the $83,000 area.
Under his setup, a sustained break above $83,000 would establish a stronger higher-high structure on the weekly chart.
Bitcoin has not yet confirmed that breakout. CoinGecko showed the latest 24-hour high near $82,012.
Bitcoin also reached $82,283 earlier in September before retreating.
That makes the $82,000-$83,000 region a more relevant near-term test than simply holding above $80,000.
Daan also highlighted the latest weekly candle after BTC swept lower liquidity and recovered.
His interpretation remains technical analysis rather than confirmation of a new bull market.
The stronger signal would come from follow-through above the recent highs.
Bitcoin Q3 Gain Reaches About 38.6%
Bitcoin’s third-quarter performance has improved considerably. CoinMarketCap recorded BTC at $58,558.86 on June 30.
CoinGecko then recorded a Sept. 20 close of $81,169. That represents a quarter-to-date increase of approximately 38.6%.
The figure is higher than the 36.7% cited in the original draft because Bitcoin continued rising after that earlier snapshot.
The quarter has also reversed much of the weakness from the first half of 2026.
Bitcoin fell more than 50% from its October 2025 record above $124,000 before reaching a June low around $58,559.
Its latest recovery has pushed price back above $80,000, although BTC remains well below the October 2025 record.
Any comparison with completed historical quarters should also remain provisional.
Q3 does not end until Sept. 30, so the final return could differ materially from the current 38.6%.
364-Day Bitcoin Cycle Does Not Yet Confirm 2026 Bottom
Crypto Patel has highlighted a longer-term Bitcoin cycle model based on repeating bull and bear durations.
The framework argues that previous Bitcoin bear markets lasted around 364 days and uses that pattern to map a future expansion toward $370,000. However, the current cycle has not completed that pattern.
Bitcoin reached its latest record around Oct. 6, 2025. Daily-close data places the current cycle low at $58,559 on June 30, 2026.
That was approximately 267 days after the peak. A strict 364-day repetition would instead point toward early October 2026.
The historical pattern is also less exact than some charts suggest.
The 2017 peak-to-2018 bottom lasted about 364 days. However, a daily-close dataset places the November 2021 peak to November 2022 bottom at approximately 378 days.
Differences can arise from the exchange, intraday price, closing-price convention and dates selected as cycle highs or lows.
That makes the 364-day framework a cycle hypothesis rather than a fixed Bitcoin rule.
Crypto Patel’s $370,000 target should be viewed in that context. A move from roughly $81,000 to $370,000 would require Bitcoin to rise about 356%. Current price action does not confirm that outcome.
Bitcoin Price Still Needs Follow-Through Above $83K
The latest weekly close improved Bitcoin’s technical structure.
BTC closed above its 50-week moving average and remained more than 35% above its June 30 close.
Still, the moving-average reclaim does not guarantee that the bear-market low is permanent.
For the immediate Bitcoin Price Prediction, $83,000 provides the clearer test.
A sustained break above that region would strengthen the higher-high structure highlighted by Daan Crypto Trades.
Failure to clear it could leave Bitcoin consolidating above the 50-week moving average near $78,800.
The $370,000 forecast belongs to a much longer-term cycle model and should remain separate from the current breakout setup.

Beatrice Mastropietro
Beatrice Mastropietro is a freelance cryptocurrency and financial markets writer with several years of experience producing news, analysis, and market-focused content for businesses, digital platforms, and media publications. She specializes in original, research-driven reporting tailored to editorial requirements, with a focus on accuracy, clarity, and integrity.