
Key Insights
- Solana crypto traded near $122 after reclaiming the $120 level.
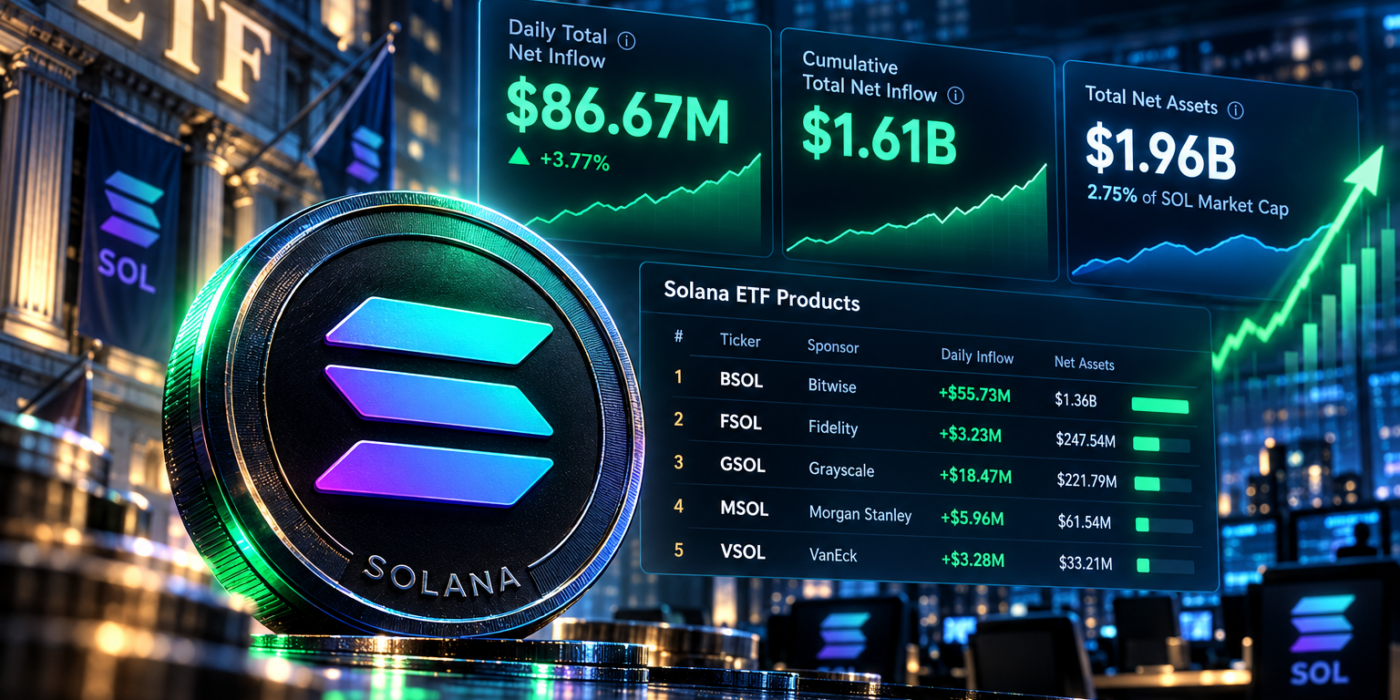
- U.S. spot Solana ETFs reportedly drew $86.67 million on Sept. 25.
- Analysts identified $150 as a major resistance level for SOL.
Solana crypto traded near $122 on Sept. 26 after reclaiming $120 this week. The move came alongside renewed demand for U.S. spot Solana exchange-traded funds.
CoinMarketCap data placed SOL near $122 during Saturday trading. The token had gained more than 20% over the past month.
ETF demand also accelerated. U.S. spot Solana ETFs reportedly attracted $86.67 million on Sept. 25, their largest daily inflow to date.
Solana Crypto Reclaims $120 After Eight Months
Solana crypto pushed above $120 after trading near $111 on Sept. 20. CoinMarketCap data showed SOL closed around $122 on Sept. 25.
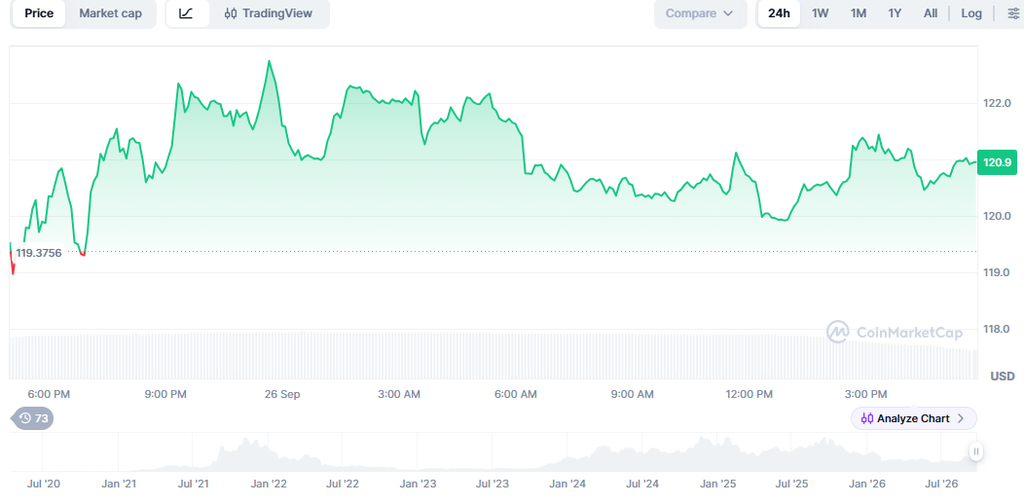
The move placed SOL around resistance that several traders now monitor closely. Price remained below the $150 level highlighted by market analyst Crypto Patel.
Patel said SOL had reclaimed $120 after roughly eight months. However, he identified $150 as the higher-time-frame level required for a broader trend reversal.
He argued that a weekly close above $150 could open higher targets. His stated targets included $250, $500 and $1,000.
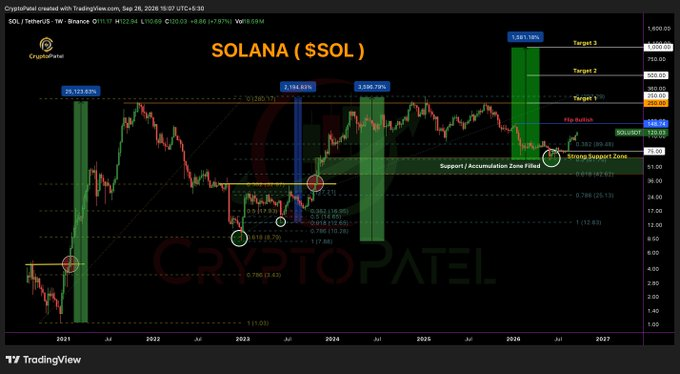
Those levels represent Patel’s technical outlook rather than confirmed price objectives. SOL would first have to rise roughly 23% from $122 to reach $150.
Patel also outlined a bearish scenario. He said rejection around $150 could send SOL toward $75 support.
Solana ETF Inflows Reportedly Hit Record $86.67M
U.S. spot Solana ETFs recorded $86.67 million in net inflows on Sept. 25, according to data reported after the session.
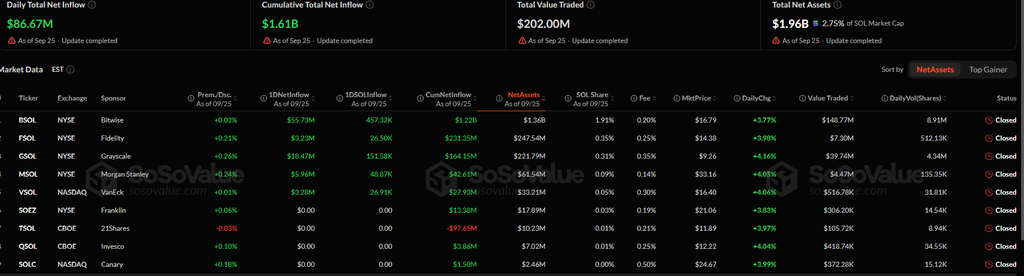
Bitwise’s Solana Staking ETF, BSOL, reportedly led with $55.73 million. Grayscale’s GSOL followed with $18.47 million.
The reported session lifted cumulative net inflows to about $1.605 billion. Total net assets reached roughly $1.964 billion.
However, Farside Investors had not incorporated those figures when its Solana ETF table was last crawled. Its dataset showed cumulative inflows of $1.512 billion through Sept. 24.
Through Sept. 24, BSOL had attracted about $1.163 billion cumulatively. Fidelity’s FSOL had recorded $226.6 million, while GSOL stood at $145.7 million.
The Sept. 25 figures therefore point to another strong session if subsequently confirmed in primary ETF-flow data.
SOL Price Meets Resistance Before $150
Trader Sweep also identified the current SOL price area as resistance. He said a correction could develop before another attempt toward $150.
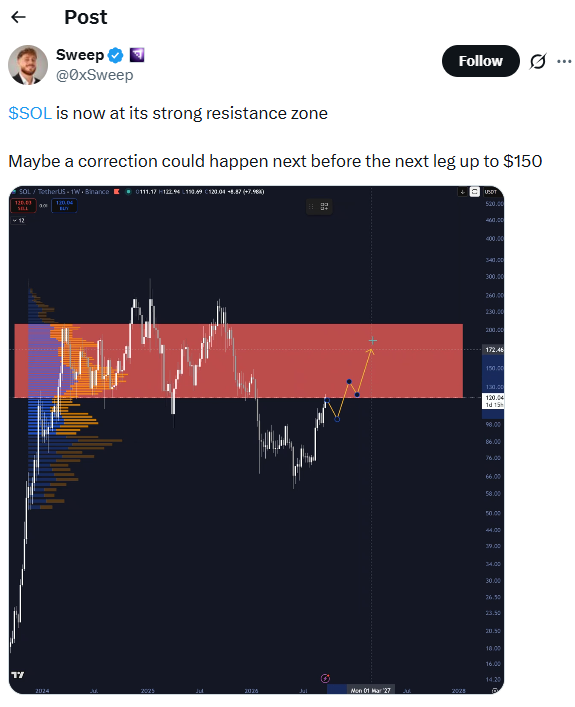
That assessment broadly matched the recent price structure. SOL climbed from around $111 on Sept. 20 to above $122 five days later.
Sweep separately highlighted the reported $86.67 million ETF inflow. He described it as Solana ETFs’ largest single-day inflow.
The analyst comments place $150 at the center of the next technical debate. However, SOL still faces nearer resistance before reaching that level.
A move from $122 to $150 would require an advance of about 23%. Failure to hold $120 could instead return attention to lower support levels.
Solana Crypto ETF Demand Adds Support
ETF flows have become an increasingly important component of the Solana market. They provide regulated exposure without requiring investors to hold SOL directly.
Farside recorded positive Solana ETF flows throughout much of Sept. 21–24. Funds attracted $26 million on Sept. 21, $28.9 million on Sept. 22 and $13.7 million on Sept. 23.
Another $32.8 million entered the products on Sept. 24. BSOL accounted for $28 million of that session.
The reported Sept. 25 inflow would mark a sharp acceleration from those sessions.
SOL now trades near a technical resistance area after its recent advance. Continued ETF demand could support the move, while traders remain focused on $150 as a longer-term breakout level.

Beatrice Mastropietro
Beatrice Mastropietro is a cryptocurrency and financial markets writer at CrypTocker. She covers Bitcoin, digital assets, blockchain regulation, market trends, institutional activity and financial technology. Her work focuses on research-driven reporting, clear sourcing and accurate market analysis.